Understanding and debugging microservices communication can be a challenge in itself. Luckily there are a bunch of tools to make it easier. In addition to the observability you get from running visualization tooling like Kiali with your service mesh, tracing provides valuable information for troubleshooting. That’s where Jaeger comes in.
Installing Jaeger
Jaeger provides an Operator, and a Helm chart to get started. Using the Helm chart, installation is simple:
$ helm repo add jaegertracing https://jaegertracing.github.io/helm-charts
to use custom settings add your own values.yaml file (e.g. an
existing ElasticSearch cluster as a datastore in this case)
storage:
  type: elasticsearch
  elasticsearch:
    host: elasticsearch.elk.svc.cluster.local  # using a local elasticsearch
    port: 9200
    # user: <USER>
    # password: <PASSWORD>
provisionDataStore:
  cassandra: false                             # disabling the default cassandra
  elasticsearch: false                         # disabling creating a ES cluster
collector:
  service:
    zipkin:
      port: 9411                               # opening the port for istio to push
Install jaeger with
$ helm install jaeger jaegertracing/jaeger --values values.yaml --namespace istio-system
Resulting in something like this
NAME: jaeger
LAST DEPLOYED: Mon Apr 11 18:36:34 2022
NAMESPACE: istio-system
STATUS: deployed
REVISION: 1
TEST SUITE: None
NOTES:
###################################################################
### IMPORTANT: Ensure that storage is explicitly configured     ###
### Default storage options are subject to change.              ###
###                                                             ###
### IMPORTANT: The use of <component>.env: {...} is deprecated. ###
### Please use <component>.extraEnv: [] instead.                ###
###################################################################

You can log into the Jaeger Query UI here:

  export POD_NAME=$(kubectl get pods --namespace istio-system -l "app.kubernetes.io/instance=jaeger,app.kubernetes.io/component=query" -o jsonpath="{.items[0].metadata.name}")
  echo http://127.0.0.1:8080/
  kubectl port-forward --namespace istio-system $POD_NAME 8080:16686
giving you the commands you need to locally check out the UI.
Adapting Istio
To see actual traces, you’ll need to edit Istio to forward data to Jaeger. Edit the istio ConfigMap in istio-system to point tracer.zipkin.address to
jaeger-collector.istio-system.svc.cluster.local:9411
You need to restart the istiod pod for the change to take effect.
Architecture
The traffic data goes from each istio-proxy sidecar to agents (running as DaemonSets on each host), to the collector, which validates, indexes and transforms the traces and either stores them or forwards them to Kafka. The default setup “samples” 1% of transactions/traces.
The github page has a great architecture diagram here.
Usage
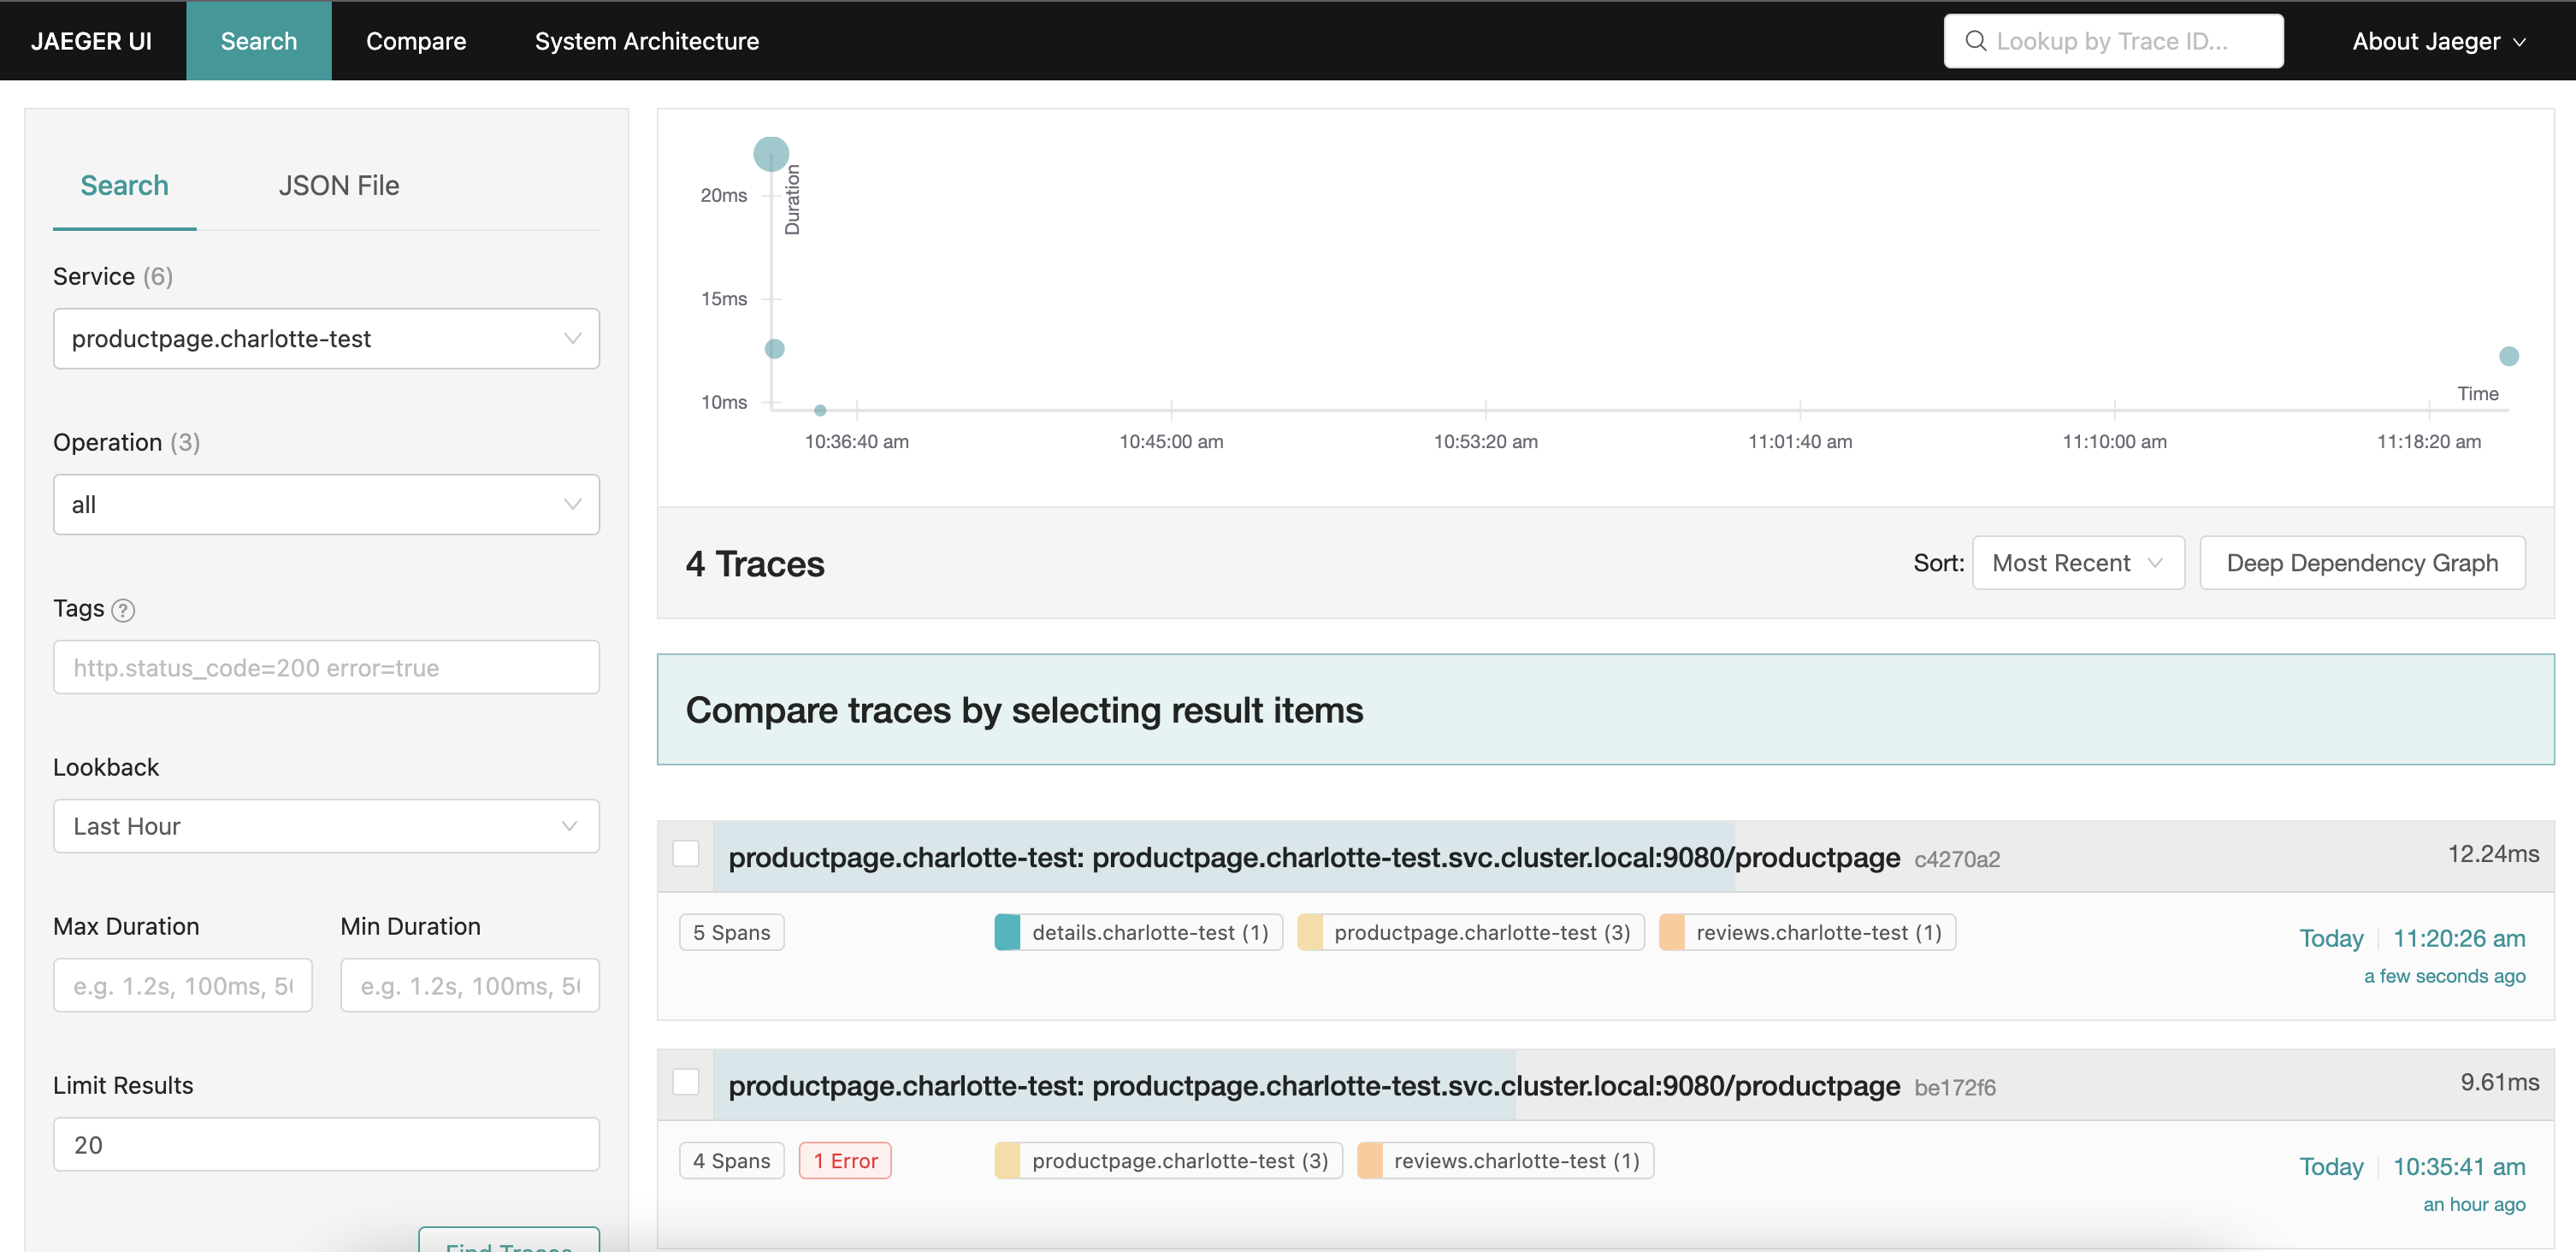
After sending a few hundred requests to your application (or bookinfo as a standin),
you can see the traces in the UI.

The System Architecture view won’t show anything, unless you’re using the all-in-one setup. For seeing the entire distributed architecture you can use Kiali or add Jaeger analytics to fill in the blank page.